Extracted and summarised from the PMI Practice Standard for Scheduling — Third Edition, 2019.
Projects are complex temporary endeavours; however, a detailed schedule model that contains logically related work allows the project to be simplified into manageable phases or groups of activities. These phases or groupings allow management to optimise the trade-offs between scope, cost and schedule. The execution of a project often proceeds differently than the initial plan and baseline — this iterative evolution is required to predict, recognise, and address those evolving factors and issues that could potentially affect project performance. Project scheduling ensures the development of effective schedule models through the application of skills, tools, techniques and intuition acquired through knowledge, formal and informal training, and experience.
Milestone: a significant point or event in a project, with a duration of zero time periods. Activity: a distinct schedule portion of work performed during the course of a project, with a duration greater than zero. Resource: skilled human resources, equipment, services, supplies, commodities, materials, budgets or funds required to accomplish the defined work. Logical relationship: a dependency between two activities, or between an activity and a milestone.
The schedule model supports the project by allowing for: time phasing of required activities; constraints that limit the options for managing a portfolio, program, project or process; resource planning; mobilisation of planned resources in the most efficient manner; coordination of events within the project and among other projects; visual representation of schedule issues to stakeholders; early detection of risks, problems, issues or opportunities; implementation of actions to achieve the project's objectives as planned; what-if and variance analysis; cost planning; and forecasting of estimate-at-complete and estimate-to-complete.
Critical Path Approach
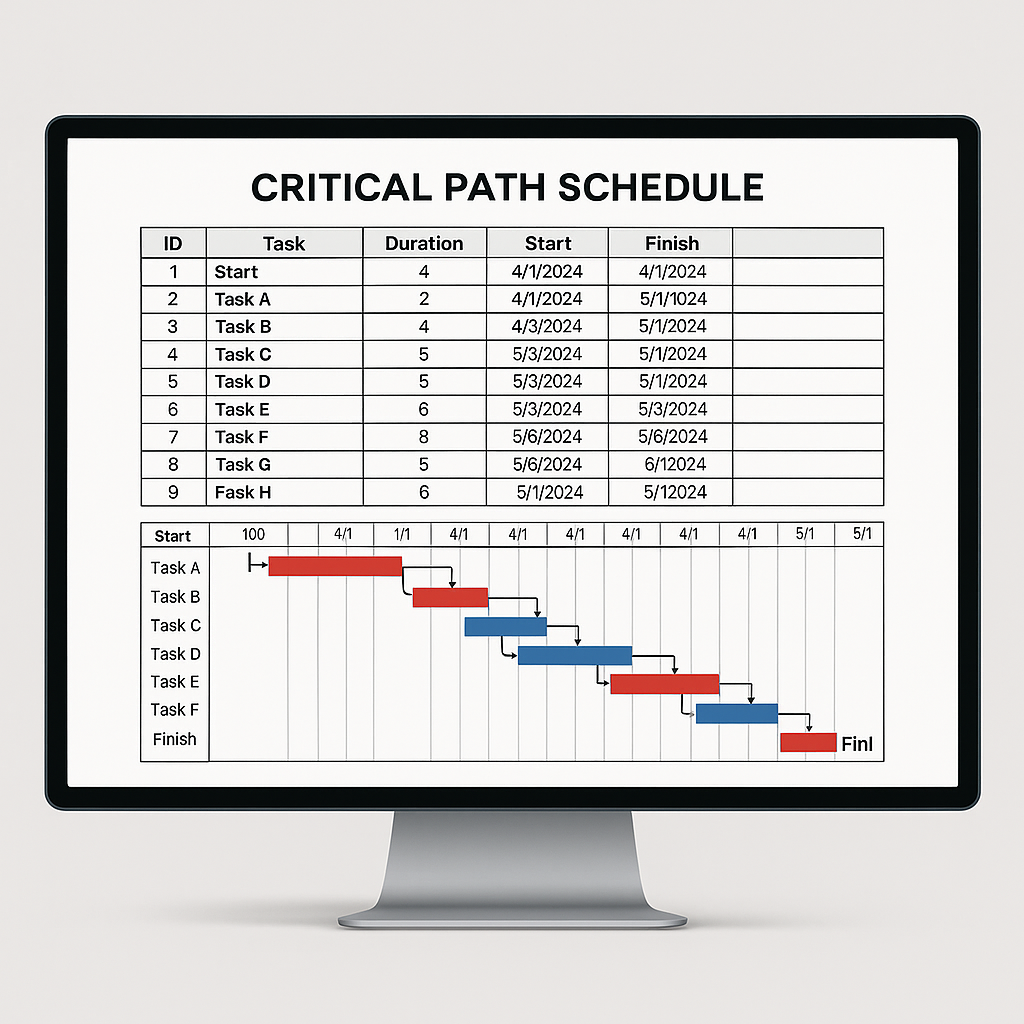
CPM refers to the prevalent approach used in modern scheduling tools and helps to identify the shortest time to complete the project. The Critical Path approach is used to derive the critical activities that cannot be delayed without delaying the end of the project. CPM determines the minimum total project duration and earliest possible finish date of the project. CPM also determines the amount of scheduling flexibility, also known as total float (TF), in the schedule model.
Location-Based Scheduling
Location-based scheduling (LBS) was developed to help project managers in the construction industry with workflows and planning. LBS is also known as the vertical production method, linear scheduling, repetitive scheduling method and flowline scheduling. This approach focuses on optimising production rates for many resources while working in parallel, often on multiple work fronts.
Lean Scheduling
Lean scheduling is based on the principles of lean project delivery (on-demand scheduling) and designed to minimise waste in order to maximise value. To achieve this goal, deliverables are not assigned to the team. Lean scheduling principles point to the importance of limiting queues by pulling work when there is capacity to place the work into the process.
Line of Balance
The line of balance (LOB) was initially developed for planning and controlling manufacturing industrial processes; later, its use was expanded as a method for planning and controlling projects with repetitive or long-duration activities. Line of balance focus is on production rates over time, rather than on defining and tracking discrete activities over time — this results in a visualization that shows the flow of work and units produced. LOB shows repetitive work in the project as a single line on a graph rather than a series of individual activities on a bar chart. This line represents the rate at which the work needs to be performed to stay on schedule, and LOB can help expose process bottlenecks. The main advantage of LOB is that it calculates productivity along with time in an easy graphical representation.
Building Information Modeling (BIM)
Building Information Modeling is a process that creates and manages information regarding the physical and functional characteristics of a building. It is used to support decision-making during the building's entire life cycle. The collection of project information in a central repository provides an opportunity to integrate the project's 3D model and the schedule model. BIM software allows identification of sequences for the design of objects, which become the underlying logic for the schedule.
Scheduling Tool and Schedule Model
A scheduling tool is typically a software application that contains algorithms, components, features, and rules to input and manipulate activities, dependencies, resources, and their assignments to create schedule model instances and schedule presentations. The schedule model is guided by a schedule management plan that identifies the scheduling approach used, the scheduling tool used, and how the activities, planned dates, durations, resources, dependencies, and constraints should be addressed. If historical data is available, this should be considered in determining duration. Constraints, including lead and lag time factors, should not be used in the schedule model to replace schedule logic.
Schedule Management Plan
The schedule management plan is a collection of processes, approaches, templates, and tools that comprise the project's execution strategy and objectives as reflected in the project's schedule model. It is unique to each project and is comprised of requirements defined by the implementing organisation as well as the project scope documents. The schedule management plan defines how the schedule model will be developed, updated, progressed, and shared.
Key components of the schedule management plan: scheduling approach; scheduling tool; schedule model creation plan; schedule model identification; schedule model instance; calendars and work periods; project update cycle and activity granularity; milestone and activity coding structure; resource planning; key performance indicators; and change control.
Schedule Model Creation
The schedule model describes the work to be done, the resources required to do the work, activity durations based on resource availability and productivity, and the optimum activity sequence based on logical relationships between schedule activities, resource availability, and calendars.
Work to be done: ensure that the project's requirements are understood and satisfied, verify resource availability and assignments.
Define milestones: once there is an understanding of the overall structure for the project data, begin to lay out the project's milestones. A milestone has zero duration, has no resources assigned, and is used as a benchmark to measure progress, and may also reflect the start and finish points for various project events. Generally a milestone represents the start or completion of a portion of a deliverable of the project. It may also be associated with external constraints, such as delivery of specific required approvals or deliverables.
Defining the project's activities: create a list of activities that need to be performed to complete the project. The characteristics of a well-defined activity include: activity owner, activity description, continuity of work, and activity duration.
Crashing the Schedule
Crashing consists of adding resources to critical activities to shorten durations, or spending money in other ways to reduce the length of activities when adding resources to reduce activity duration. Crashing only works for activities that are effort-driven. Crashing should only be performed on activities on the critical path, and then only on those activities that yield the most cost-effective result. Crashing typically increases project costs by some factor.
Fast Tracking
Fast tracking consists of changing the logic for overlapping critical activities rather than working them strictly in sequence. Fast tracking increases the risk of rework because the activity is started before its predecessors are completed, and possibly contributes to an increased number of change orders on contracted work.
Schedule Levels
Level 0 — Project Summary: a single line representing the entire project, often used for comparing projects in a program or portfolio. Audiences include strategic partners, senior executives, portfolio or program managers, and operations managers.
Level 1 — Executive Summary: a higher-level schedule that includes key milestones and summary activities by major phase, stage, or project being executed, typically represented in bar chart format and may originate in a table of key elements or a graphic. Level 1 schedules provide high-level information to assist in the decision-making process. Audiences include customers, senior executives and general managers.
Level 2 — Management Summary: generally prepared to communicate the integration of work throughout the life cycle of a project. Level 2 schedules may reflect interfaces between key deliverables and project participants required to complete the identified deliverables, typically presented in bar chart format and rolled up from a more detailed schedule. Audiences include customers, general managers, sponsors and program or project managers.
Level 3 — Publication Schedule: generally prepared to communicate the execution of the deliverables for each of the contracting parties. The schedule should reflect interfaces between key work groups, disciplines or crafts involved in execution of the project, in a bar chart or CPM network format.
Level 4 — Execution Planning: reflects interfaces between key elements that drive completion, typically presented in bar chart or CPM network format and usually providing enough detail to plan multi-discipline activities accordingly. The period covered by a level 4 layout or report is usually one week to one month, and supports the milestones and durations represented in a level 3 schedule.
Level 5 — Detailed Planning: prepared to communicate task requirements for completing activities identified in a detailed schedule. A level 5 schedule is usually considered a working schedule that reflects hourly, daily or weekly work requirements, and is usually prepared one day or one week in advance. The period covered by a level 5 layer is usually one day to one week, supporting the milestones & durations represented in the level 3 or 4 schedules.
Schedule Model Maintenance
Collect actuals and remaining work or duration; update the schedule model according to the actuals; compare and address any deviation; update the schedule model with approved changes; update the baseline schedule model; communicate; maintain the records; and apply change control to the schedule model.
Schedule Model Analysis
The primary objective of the analysis is the early identification of threats and opportunities to the project objectives. The project's critical path is one of the key components to understanding project performance and accurately monitoring its forecasted movements, based on inputs made over time to the project. The critical path is the sequence of activities that predicts or defines the longest path and shortest duration for the project — it is the longest path through the project, starting at the earliest milestone through to project completion, and determines the duration of the project. Critical path calculations consider activities and constraints to determine the longest path in the project. However, a critical path can end, for example, on a schedule milestone that occurs at any point within the schedule model and that has a finish-no-later-than constraint.
Critical Activities
It is important to distinguish between critical path activities and critical activities. Critical path activities are those activities contained in the critical path or paths. Critical activities are those activities vital to the success of a project, even when they do not appear on the "critical path" — these can be high risk in terms of scope, schedule, resources, safety, environment, cost, and can cause a delay in the project end date.
Total Float & Free Float
Free Float (FF) represents the amount of time an activity's early finish date may be delayed without affecting any successor activity's early start date — FF is relevant to an individual activity. Total Float (TF) represents the amount of time an activity's early start date or early finish date may be delayed without impacting the project finish date. Changes to TF indicate a threat to achieving project completion; changes to FF indicate a lack of progress, which may impact successor activities.
Estimation of Activity Durations
When there is a great deal of uncertainty in activity duration, a commonly used estimating technique is the three-point estimate. The three points are based on optimistic, pessimistic and most likely durations. PERT (Program Evaluation & Review Technique) = [optimistic duration + 4 × most likely duration + pessimistic duration] / 6. Optimistic duration is the minimum activity duration, occurring under the most favourable conditions; most likely duration is the activity duration that will occur most often; pessimistic duration is the maximum activity duration that will occur under the least favourable conditions.
Date Constraints
Date constraints restrict the "free flow" of the activity logic and the ability of the schedule to react to changes. Constraints can also disregard risks and impact the usefulness of Schedule Risk Analysis. When a date constraint becomes necessary, more flexible constraints are preferred.
Open-Ended Activities
Activities without a predecessor and/or successor create a false appearance of float, reduce the impact of risk or change, and result in questionable validity of the schedule and a questionable critical path.
Out-of-Sequence (OOS) Logic
Occurs when reporting progress — an activity starts, ignoring its predecessor(s), i.e. ignoring the logic relationship. Is the logic correct? Does the predecessor task have to be completed?
Leads & Lags
Lead: a relationship that allows acceleration of the successor activity, shown as a negative value. Lag: a relationship that imposes a delay of the successor activity, shown as a positive value.
Start-to-Finish Relationship
Activity logic that involves the circumstance of a successor task occurring before its logical predecessor.
Links To/From Summary Activities
Not recommended, as the logic can be difficult to follow/trace. Using links to summary tasks may produce logic errors or create circular logic.
Schedule Risk Analysis / Assessment
Used to validate schedules (completion dates, contingency periods). PERT does not recognise logic paths. Monte Carlo simulations run numerous schedule simulations/iterations — risk inputs are modeled and a probabilistic completion date is calculated.
Earned Value Method (EVM)
EVM is a method for calculating schedule variances, performance, and likely outcomes given current performance. It is associated with time-based analysis, provides an accurate understanding of cost, and provides various indicators and indices.
Communication & Reporting
Clear communication of the schedule/performance builds credibility for stakeholders. Common report types include: critical path reports, WBS reports, weekly/monthly detailed schedules, resource reports, dependencies reports, critical issues reports, schedule risks reports, progress reports, quantity reports, and visual dashboards.