Lesson 2: Scheduling Methods
Before working through how the critical path is calculated, it helps to understand the two main scheduling methods used in construction — and how the Critical Path Method builds on the simpler Bar Chart approach.
Bar Chart (Gantt Chart) Scheduling
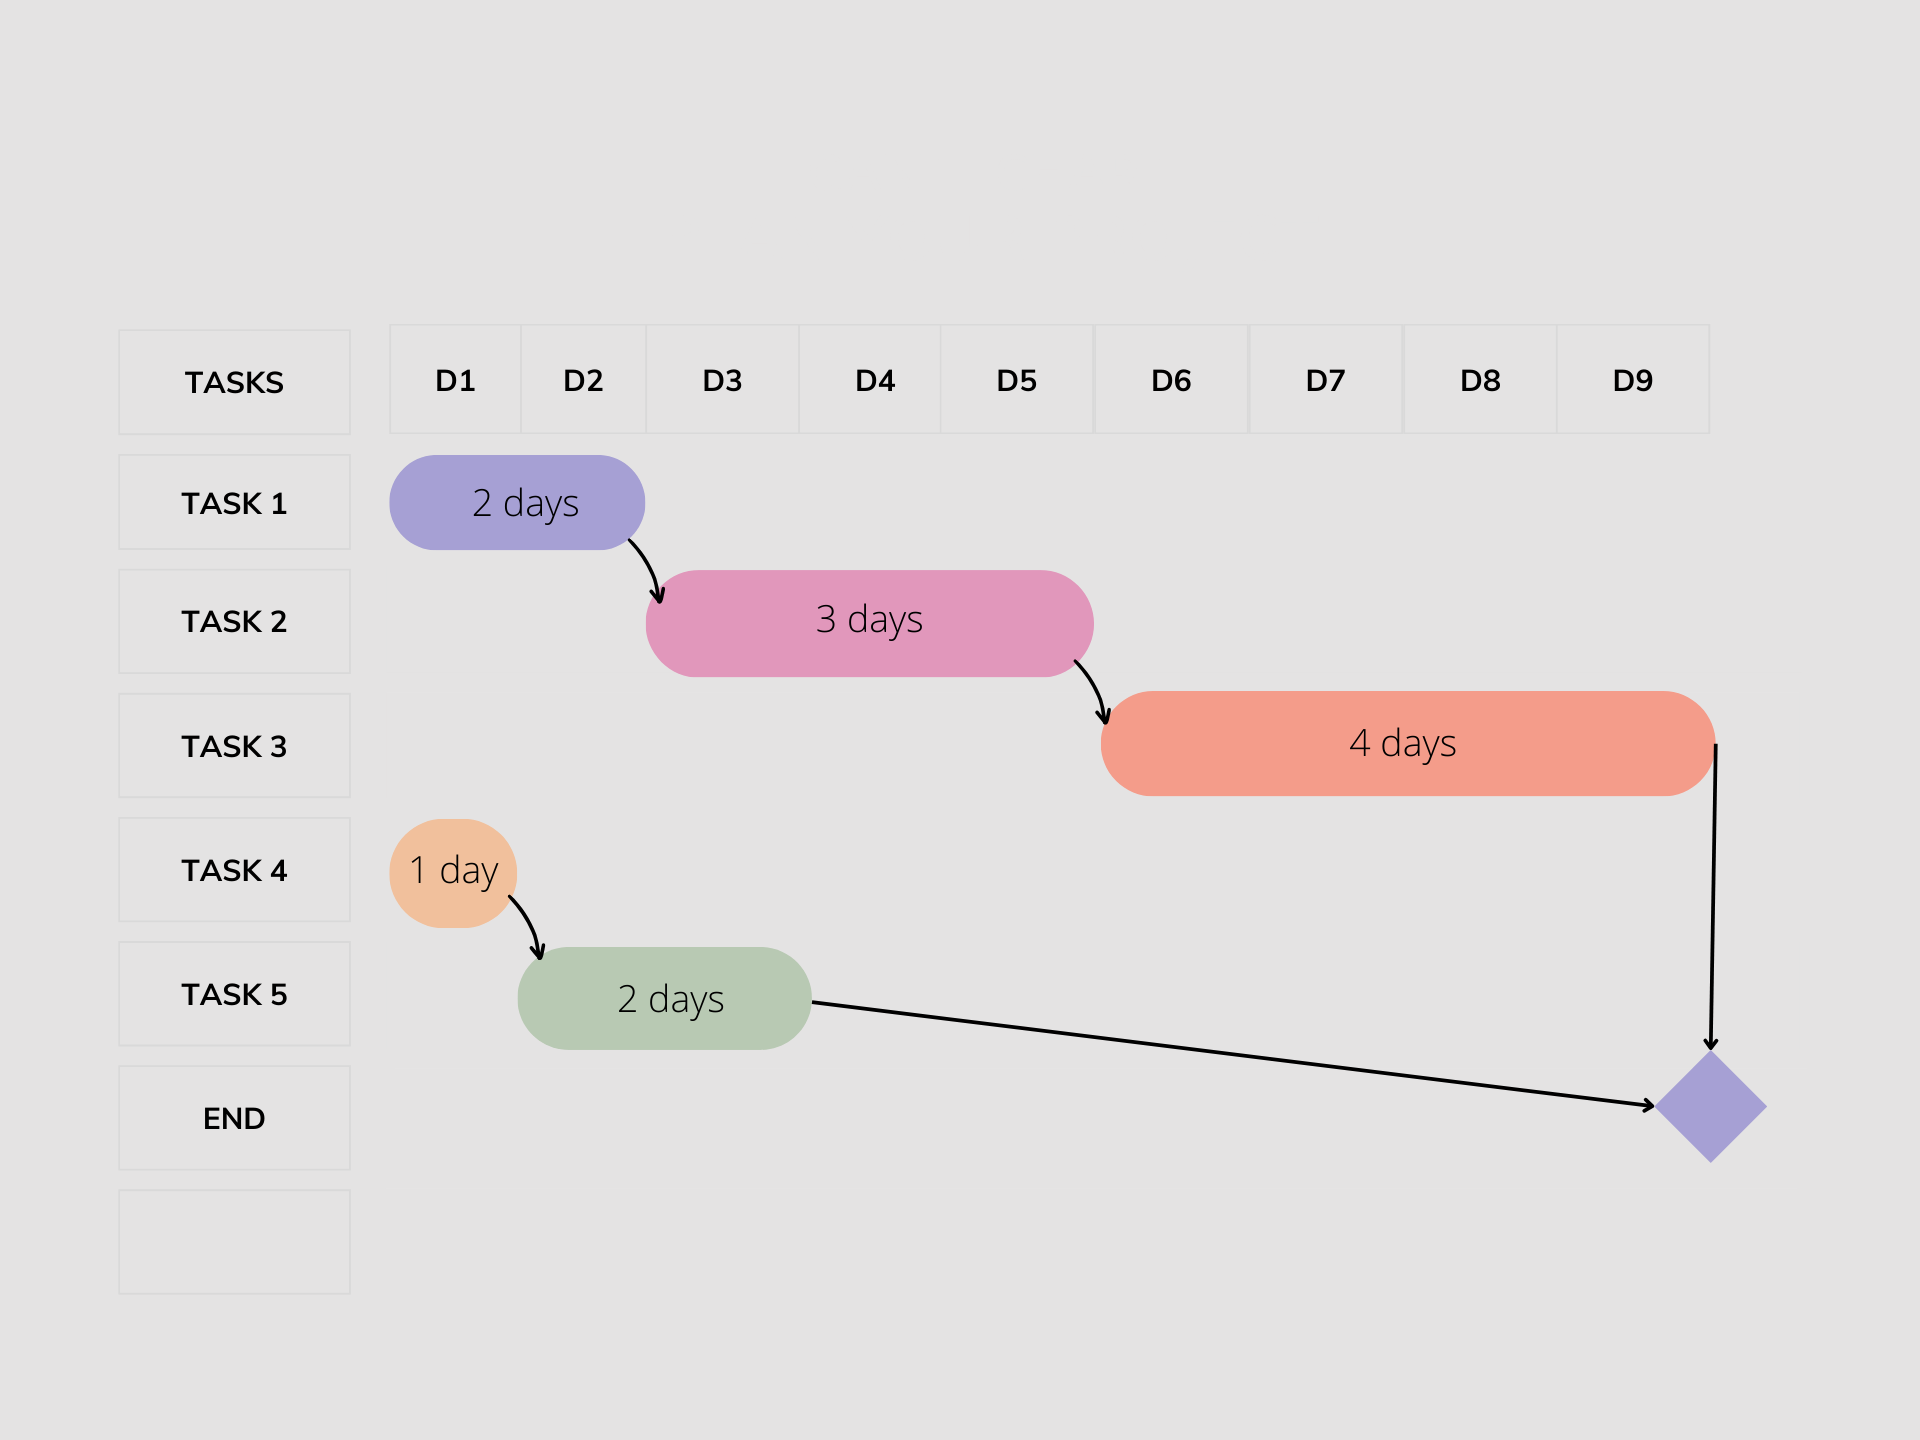
A Bar Chart — also known as a Gantt Chart — is the simplest scheduling method. It defines the schedule using two variables:
The calendar — when each activity starts and finishes, expressed as a duration on a horizontal time axis.
The activities or tasks — the list of work items that need to be completed to deliver the project.
Activities are shown as horizontal bars on a time axis. A Bar Chart is simple, visual, and easy to communicate — but it has one critical limitation: it does not show the logical dependencies between activities. There is no way to calculate which activities are truly critical or to determine the impact of a delay on the project end date.
Critical Path Method (CPM) Scheduling
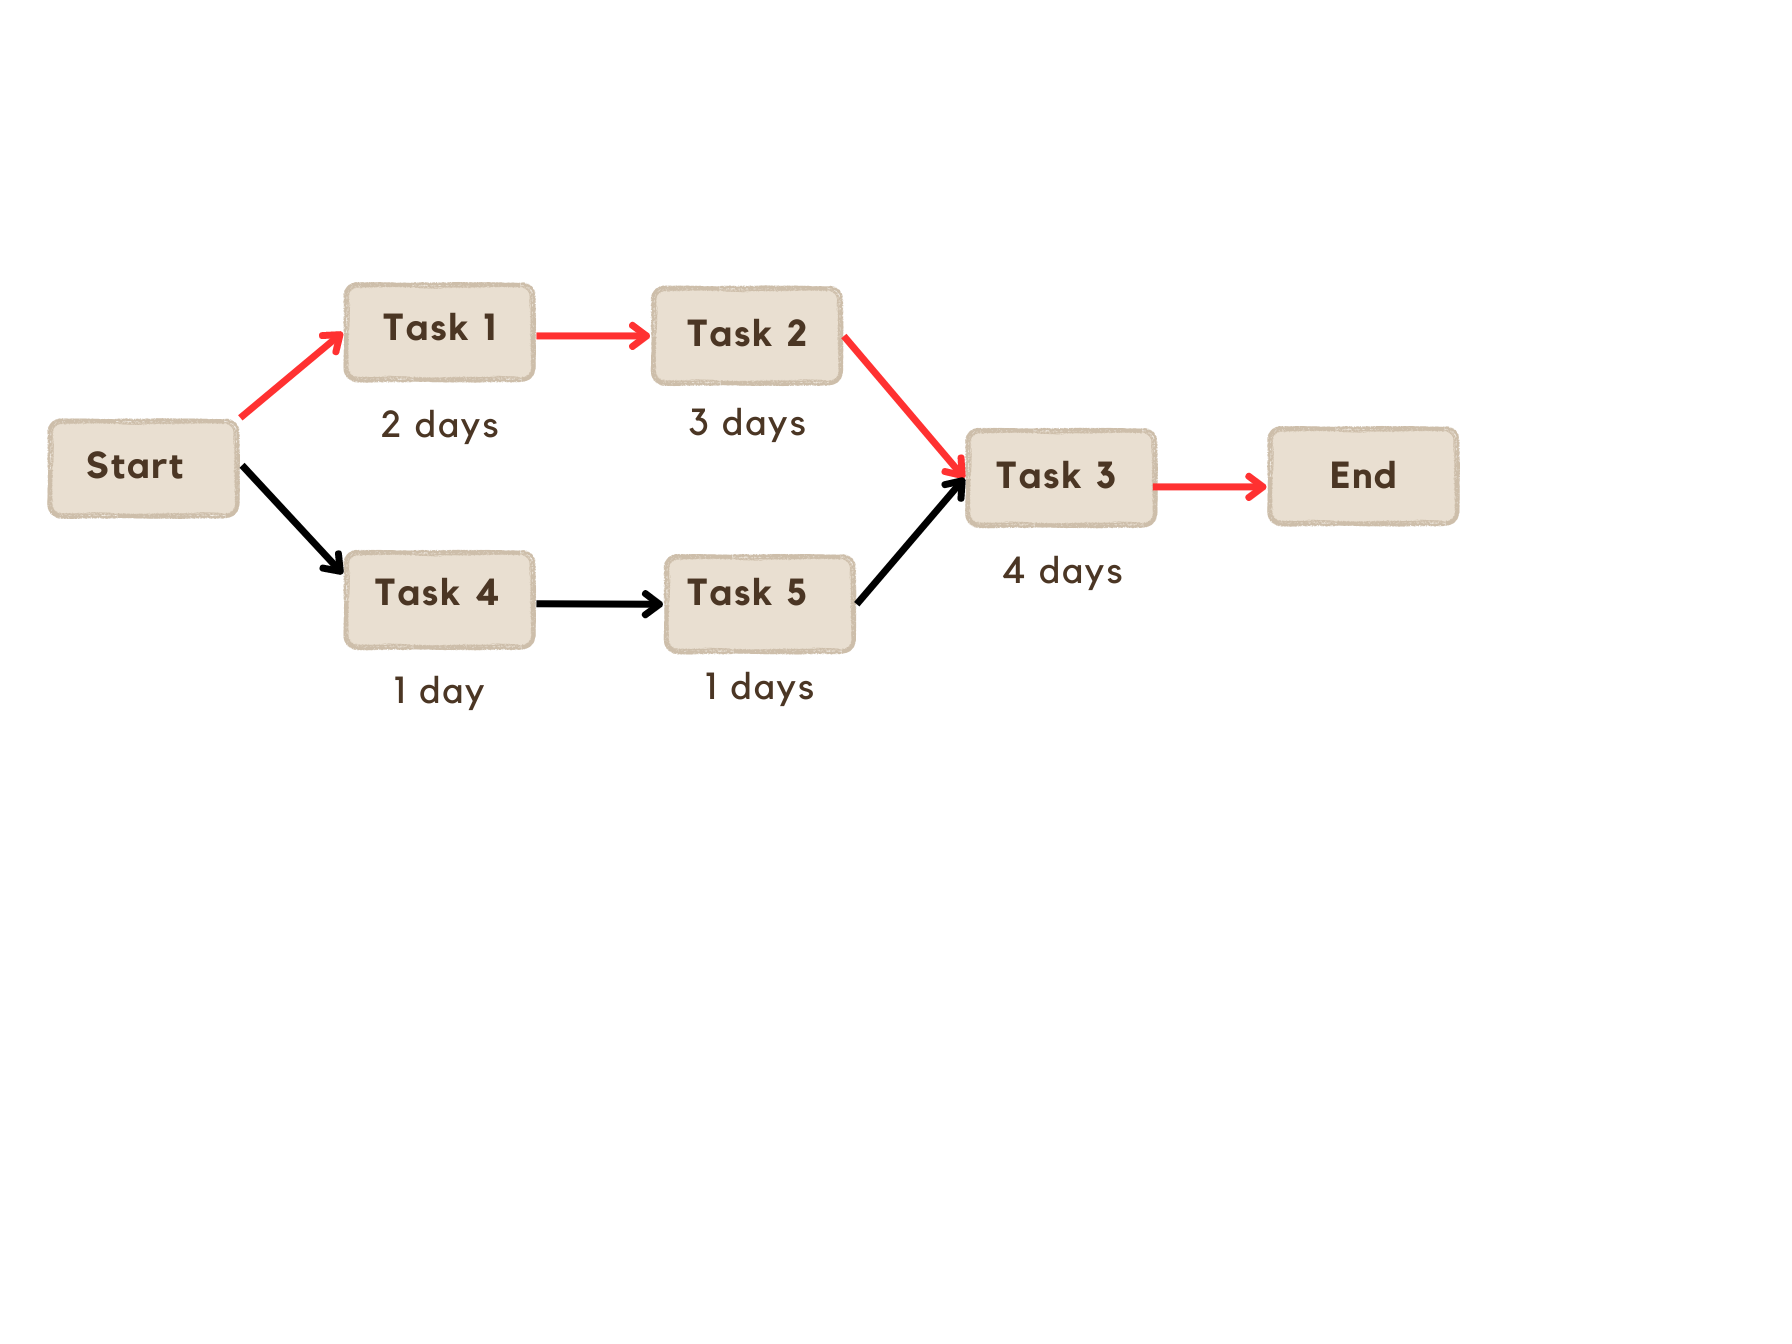
The Critical Path Method adds a third variable to the Bar Chart, fundamentally changing what the schedule can tell you:
Duration and calendar — same as the Bar Chart.
Activities and tasks — same as the Bar Chart.
The relationships and dependencies between activities — which activities must be completed before others can begin.
By adding Logic, the schedule becomes a network. The software can now calculate Early Start, Early Finish, Late Start, Late Finish, and Total Float for every activity — and identify the Critical Path: the sequence of activities with zero float that drives the project end date.
Calculating the Critical Path — Manual Method
CPM scheduling software calculates the critical path automatically. But understanding the manual method helps you interpret the results, spot errors, and make better scheduling decisions. We'll work through a simple 5-activity example.
Step 1: Build the Activity Network
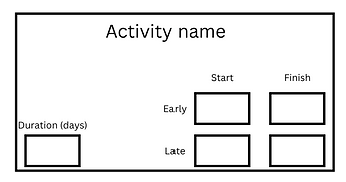
Start with a list of activities, their durations, and their dependencies. Build an Activity Network Diagram (Precedence Diagram) showing the flow from Start to End, with logic links as arrows. For each activity, create a node with spaces for the four key dates: ES, EF, LS, LF.
Step 2: Forward Pass — Calculate Early Dates
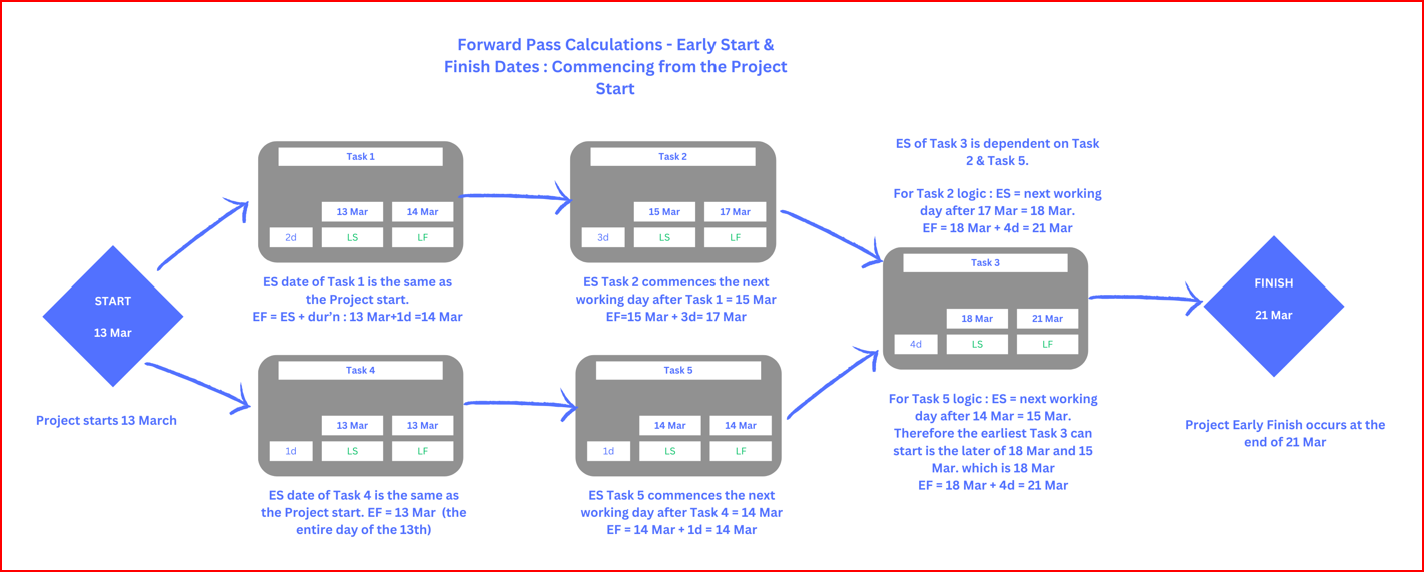
Working left to right through the network, calculate the Early Start and Early Finish for each activity:
- Early Start (ES) = the Early Finish of the preceding activity. Where there are multiple predecessors, take the latest Early Finish.
- Early Finish (EF) = ES + Duration.
- The project's earliest completion date is the EF of the final activity (or the latest EF of all final activities).
Step 3: Backward Pass — Calculate Late Dates
Working right to left from the project end date, calculate the Late Finish and Late Start for each activity:
- Late Finish (LF) = the Late Start of the succeeding activity. Where there are multiple successors, take the earliest Late Start. For the final activity, LF = project completion date.
- Late Start (LS) = LF − Duration.
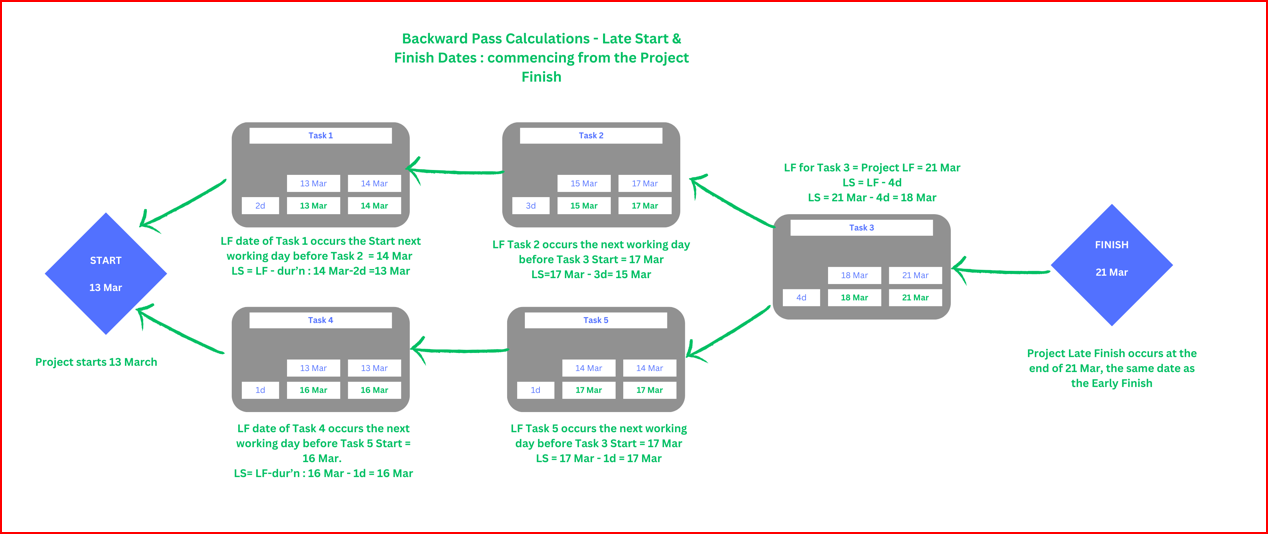
Step 4: Calculate Total Float & Identify the Critical Path
For each activity: Total Float (TF) = LS − ES (or TF = LF − EF). Activities with zero float form the critical path — any delay to these activities delays the project finish date by the same number of days.
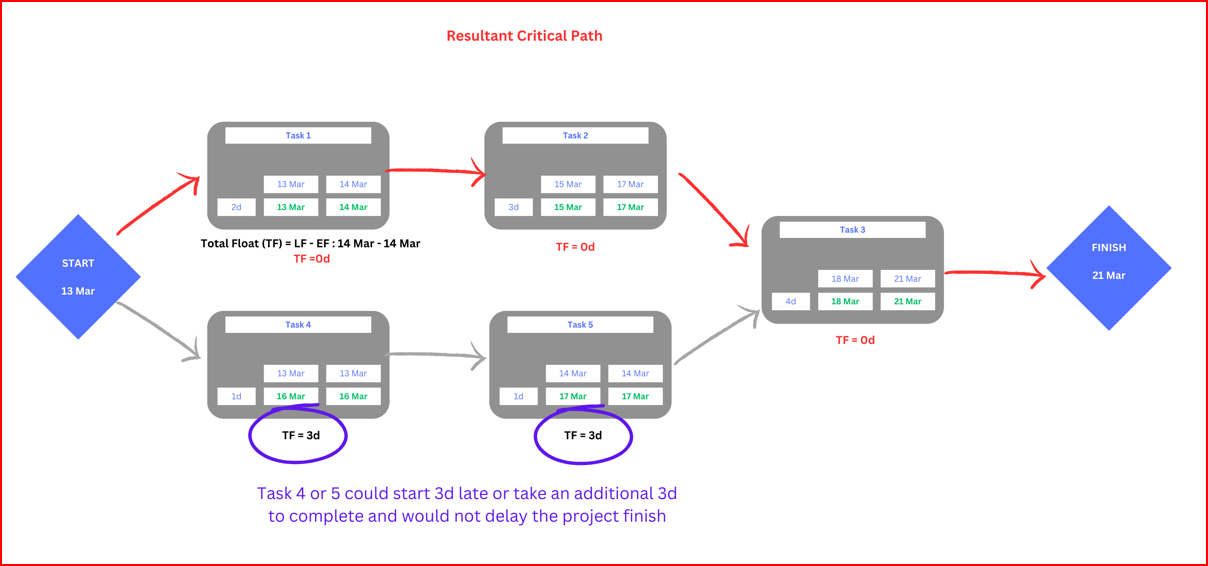
Real construction schedules have hundreds or thousands of activities — CPM software handles the calculations. But understanding the forward and backward pass lets you interrogate the software output, identify logical errors, and explain the critical path clearly to clients and project teams.
CPM Scheduling Software
The three primary CPM scheduling software packages used in construction are Oracle Primavera P6, Microsoft Project, and Asta Powerproject (Elecosoft). Each performs the forward and backward pass calculations automatically — the difference lies in their architecture, capabilities, and typical industry application.

Origins
Originated as Eagle Ray in the 1990s, later developed by Primavera Systems and acquired by Oracle. Designed from the outset for large, complex project management.
Developed in the US in 1984, initially targeting software development projects. Grew into a broadly adopted general-purpose project management tool.
Developed in the UK in the early 1980s by Elecosoft, with a specific focus on building and construction scheduling from the outset.
Architecture
Enterprise-grade relational database architecture (Oracle DB or SQLite). Supports multi-user access, role-based security, and portfolio-level project management across thousands of activities and multiple simultaneous schedules.
File-based architecture (.mpp files). Project Server / Project Online provides enterprise functionality, but the standalone desktop product is single-user. Part of the Microsoft 365 ecosystem.
File-based or SQL Server-backed architecture. Supports multi-user via Asta Enterprise. Known for a flexible concurrent (floating) licensing model that reduces cost on large projects.
Industry Usage
The industry standard for major infrastructure, oil & gas, mining, and large commercial construction. Required on most government and Tier 1 contractor projects in Australia.
Widely used by residential builders, architects, quantity surveyors, and smaller civil contractors. Valued for its simplicity, familiar interface, and low cost.
Large commercial construction and building developers, particularly in the UK. Growing adoption in Australia. Valued for construction-specific features and cost-effective licensing.
Advantages & Disadvantages
| Software | Advantages | Disadvantages |
|---|---|---|
| Primavera P6 | Handles very large data sets; enforces correct update methodology (actual dates, remaining duration); robust baseline and forecasting tools; industry-standard for major projects; strong activity coding and filtering | Graphical/Gantt view limitations; requires careful management of planned dates and baseline data; higher cost and IT complexity; steeper learning curve |
| MS Project | Easy to use; widely recognised; cost-effective; simple deployment within Microsoft 365 environments; suitable for smaller projects | Limited relationship modelling; challenges with complex multi-resource calendars and large schedule data sets; baseline management less robust than P6; not suited for major infrastructure projects |
| Asta Powerproject | Extensive scheduling and visualisation options; construction-specific features (hammocks, task bars, free-float bars); cost-effective concurrent licensing; free project reader available | Smaller market penetration in Australia; fewer skilled operators available; steeper learning curve for those moving from P6 or MS Project |
In the next lesson we look at how the critical path is confirmed in practice — understanding total float thresholds, near-critical paths, and how the critical path evolves as a project progresses.