Lesson 1: Introduction to Earned Value Management
Earned Value Management (EVM) is a project management technique used for measuring project performance and progress in an objective manner. It integrates project scope, cost, and schedule measures to help project managers assess a project's performance, identify issues early, and take corrective action before problems escalate.
- Progress % reporting must be accurate
- For accurate % complete, the schedule must be understood by those reporting against it
- For the schedule to be understood, the whole project team must be on-board and own the schedule
EVM is only as good as the data that feeds it. Garbage in, garbage out.
Key Concepts — The Three Core Metrics
EVM is built on three core metrics. Everything else — the variances and performance indices — is derived from these three values.

EVM Formulas — Variances and Performance Indices
From the three core metrics, four key performance measures are derived. These are the numbers that tell you whether your project is healthy.
The S-Curve — Visualising EVM
The most powerful way to communicate EVM data is through the S-curve: a time-based plot of PV, EV, and AC on a single chart. The characteristic S-shape arises from the typical pattern of construction projects — slow start, peak production in the middle, tail-off at the end.
Reading the S-curve is intuitive once you understand the three lines:
What you planned to achieve. The benchmark everything else is measured against. Ends at BAC.
What you have actually spent. If this rises faster than EV, costs are running ahead of output — a warning sign.
What you have earned — value of work completed expressed in budget terms. If below PV at the status date, you are behind schedule.
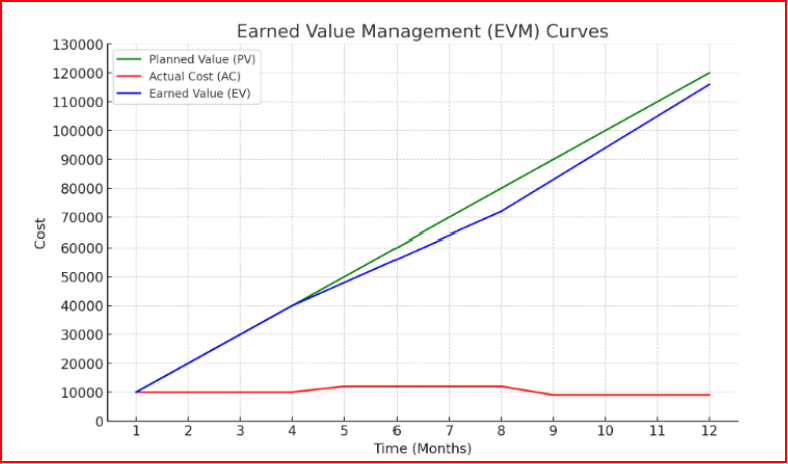
Worked Example — Reading the EVM Curves
Consider a 12-month project with a BAC of $120,000, planned to progress linearly at $10,000 per month. The following scenario plays out:
- Months 1–4: Project progresses as planned — $10,000 per month spent, $10,000 per month earned.
- Months 5–8: Issues arise. Actual Costs climb to $12,000/month but only $8,000/month of work is being completed — over budget and behind schedule simultaneously.
- Months 9–12: Corrective actions take effect. Costs reduce to $9,000/month and progress recovers to $11,000/month of earned value.

- Where AC exceeds EV, the project is over budget — you are spending more than you are earning.
- Where EV is below PV, the project is behind schedule — you have completed less work than planned.
- Where the EV curve steepens in months 9–12, corrective actions are working — progress is recovering.
- The gap between PV and EV at project end shows the project did not fully recover — it finished behind the original plan.
Implementing EVM
For EVM to function correctly on a project, three foundations must be in place:
A detailed, approved project scope, schedule, and budget. Without a stable, agreed baseline, there is nothing to measure performance against. The baseline is sacred — changes must be managed through a formal change control process.
Both the schedule status (% complete) and the actual costs must be updated at consistent intervals — weekly or monthly. The data date must align between the cost and schedule systems. Late or inconsistent updates make EVM meaningless.
EVM calculations are straightforward, but tracking them across hundreds of activities requires robust tooling. CPM scheduling software (P6, MSP, Asta) can hold EVM data, but the reporting outputs are often limited — exporting to Power BI, Excel, or specialist EVM tools is the norm for producing the dashboards and trend charts that management actually needs.
Benefits of EVM
EVM provides quantitative, data-driven project health metrics. It eliminates subjective "traffic light" status reporting where a project can be reported as "Green" right up until it fails.
Continuously monitoring CV, SV, CPI, and SPI trends allows issues to be identified weeks or months before they become critical. A declining CPI trend is a powerful early warning signal.
EVM data supports fact-based decisions on scope changes, resource allocation, and schedule recovery — rather than gut-feel or political pressure.
Demonstrating control over scope, schedule, and budget with objective data builds confidence with clients, owners, and financiers. EVM is frequently mandated on government and publicly funded projects for this reason.
Limitations — What EVM Does Not Tell You
Like any management tool, EVM has limitations. Understanding them makes you a better user of the system — not a reason to avoid it.
Challenges on Large and Mega Construction Projects
While EVM is well-established in theory, large construction projects present practical challenges that are often underestimated at project outset.
Mega projects involve complex structures and numerous stakeholders. Gathering accurate, timely data from all parties is difficult. Delays in cost reporting or inconsistent data entry lead to misleading calculations. A particularly common misalignment: the schedule may break down a concrete slab into Survey → Site Preparation → Formwork → Rebar → Concrete, while the cost system budgets the whole element as 'Level X Structure' — until subcontract packages are awarded, the WBS and CBS simply do not align.
The scope of a mega project frequently shifts mid-construction due to design changes, unforeseen ground conditions, or client variations. Frequent baseline revisions make it difficult to track true performance — you end up comparing actuals against a moving target.
EVM requires consistent application by a team with varying experience levels. Pressure to meet targets can lead to data manipulation — inflated % complete, understated actual costs — that masks underlying problems and delays corrective action.
Mega project schedules have intricate interdependencies. CPM software is excellent at processing thousands of activities and complex relationships, but its reporting output is often poor. Exporting data to Power BI, Excel, or specialist reporting tools to produce dashboards, heat maps, and trend charts has become the industry norm — but this integration adds complexity and risk of data errors.
Making EVM Work — Key Actions
The single most important factor. If the project team does not understand or own the schedule, % complete figures will be guessed, EV will be unreliable, and EVM adds no value.
Automate data collection where possible, freeing up quality time for the team to review status, understand the impact of updates on the schedule, and agree on mitigations — rather than chasing numbers.
Before building the schedule, ask: What EVM reports are required? Who is the audience? Does the CPM software produce sufficient EVM outputs, or does data need to be exported? Does the Schedule WBS align with the Cost Breakdown Structure (CBS)? Do activities need special coding to communicate with cost systems?
Establish a culture of honest status reporting. Provide training on EVM principles. Set up clear protocols for baseline changes. EVM only creates value when the data it relies on is trusted.
- EVM integrates scope, schedule, and cost into a single performance picture
- The three core metrics are PV (planned work), EV (work done), and AC (money spent)
- SV = EV − PV (schedule variance); CV = EV − AC (cost variance)
- SPI = EV ÷ PV; CPI = EV ÷ AC — values >1.0 are favourable
- EVM is only as good as the underlying data — accurate schedule status and timely cost reporting are essential
- On large projects, WBS and CBS misalignment is one of the most common and least-discussed EVM failures
Lesson 1 Quiz — EVM Fundamentals
Test your understanding. Select the best answer for each question.
Q1. Earned Value (EV) is best described as:
Q2. If a project has EV = $80,000 and AC = $95,000, the Cost Variance (CV) is:
Q3. A Schedule Performance Index (SPI) of 0.75 means:
Q4. Which statement about Planned Value (PV) is correct?
Q5. On a mega project, the most common cause of EVM data being unreliable is:
Discussion Questions
Q6. A project reports an SPI of 1.1 and a CPI of 0.85. What does this tell you about the project's performance? What questions would you ask the project team?
Q7. The schedule WBS for a tunnel project breaks excavation into 20 individual activities. The project cost system has a single line item: "Tunnel Excavation — $12M." Describe the challenge this creates for EVM reporting and suggest how it might be addressed.